
By: Galina Markova, Data Scientist at Screen6
The coverage of a device graph—that ever-vital map that links individuals to all of the devices they use—is a combination of metrics and considerations.
While the determination of a device graph’s performance depends on how it is used, one of the most common metrics to consider is coverage. Coverage represents a single and easily interpretable number that shows what portion of your traffic can be found within the device graph. However, there’s a lot of complexity behind that seemingly simple number.
Coverage will pretty much never equal 100 percent for a couple of key reasons:
- If a person only has one identifier (ID), it cannot be clustered and will not be included in the device graph by design
- There may not be enough information within the dataset to deduce a behavioral pattern that would enable an ID to be clustered with one or more other IDs.
- There are inherent flaws to using only deterministic data for cross-device or intra-device such as bad data, consumers who knowingly input false information such as a fake email, reach issues and legal considerations such as GDPR.
- The coverage for a given set of source data can also vary depending on how it is computed.
Here are a few key considerations for interpreting coverage as an indicator of a device graph’s performance.
Unique IDs vs. Event-Based Coverage
With unique ID coverage, the calculation is based on the number of unique IDs within the source data, regardless of the frequency at which a given ID is observed. Therefore, the number can differ greatly from an event-based coverage, which is based on the number of occasions an ID in the graph is observed in the traffic.
Example: Unique ID Coverage vs. Event-Based Coverage
- Traffic:
- ID1, ID1, ID1, ID1, ID2, ID3, ID3, ID3 (3 Unique IDs, 8 events)
- Unique IDs & Events included in the device graph:
- ID1, ID3 (2 IDs occur 7 times in the traffic)
- Coverage:
- On IDs = (2 matched IDs / 3 total IDs) = 67% match rate
- On Events = (7 events / 8 total events) = 88% match rate
Coverage for Analytical or Targeting Purposes
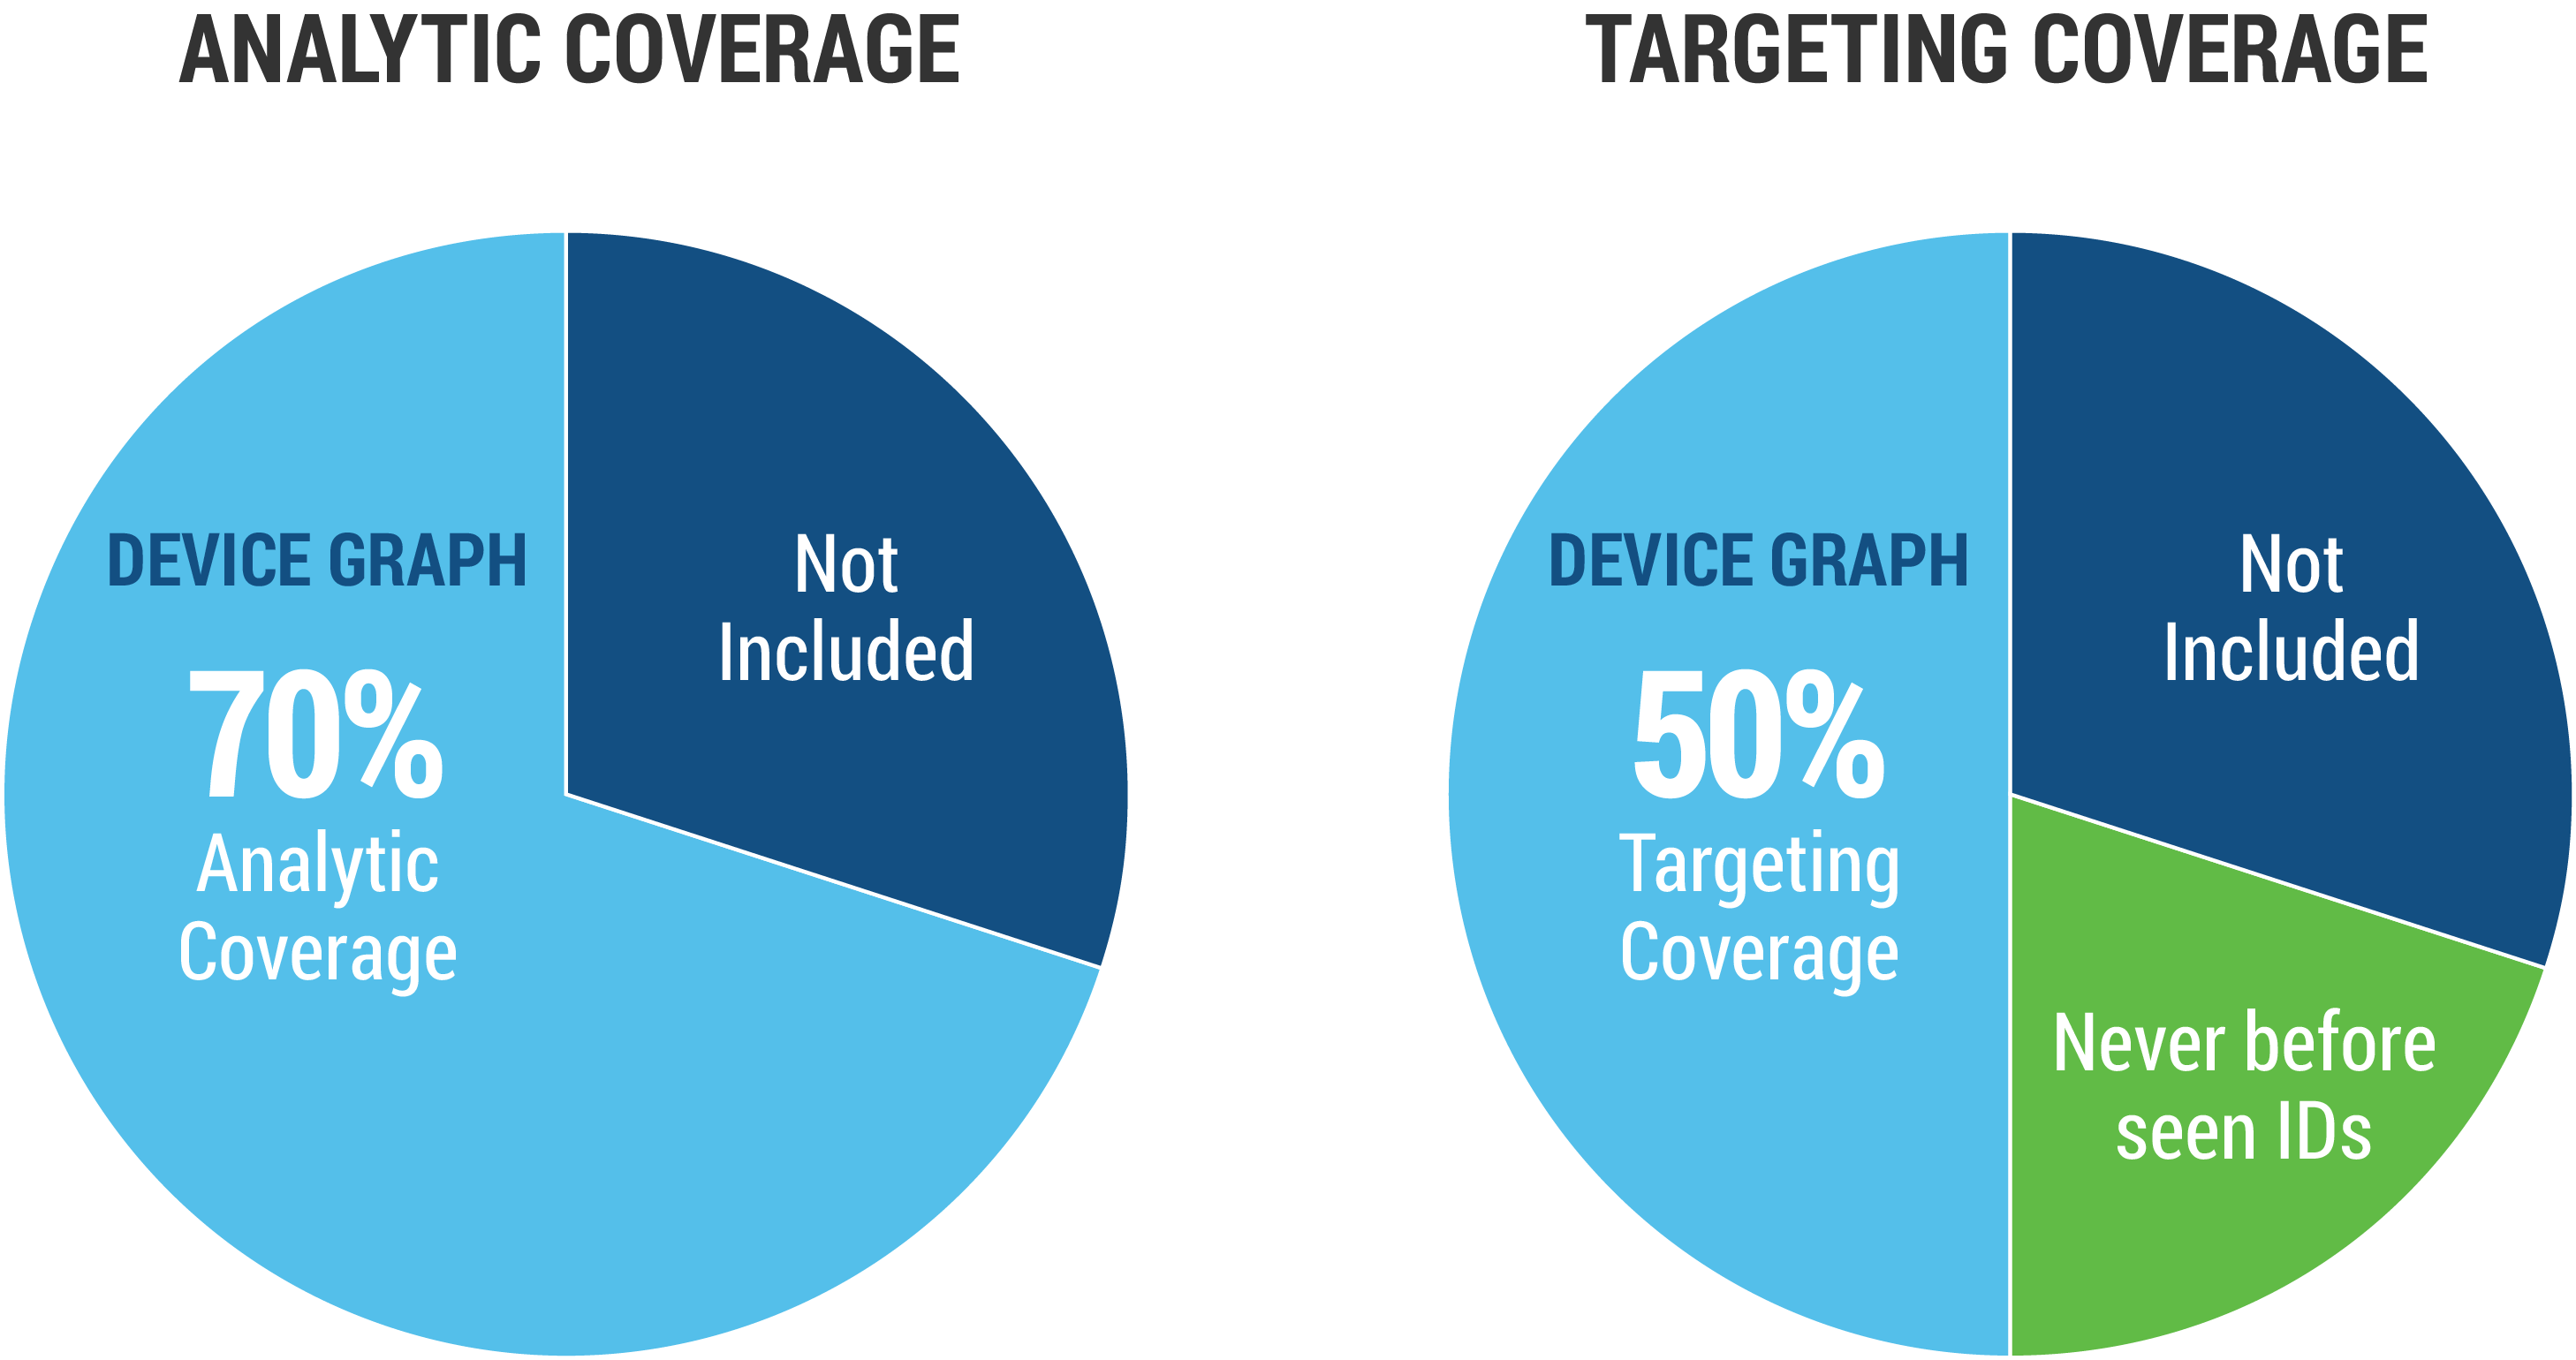
In the case of an analytics scenario, the coverage should be computed by overlaying past traffic over the device graph. Coverage computed this way will determine the performance of the graph when applied for conversion attribution and campaign reach-frequency analysis.
In the case of targeting, the coverage should be computed by overlaying traffic that is ahead of the data that was used to generate the device graph. This scenario is used to evaluate cross-device targeting success. Important to note: the targeting coverage is usually lower than the analytical coverage. Lower coverage is due to ID depreciation and the addition of user IDs that have not yet been observed during the time of creation of the device graph. The more frequent the device graph is updated, the lower the difference. When real-time matching is applied, there is no difference.
Figure 1
Additional Considerations
The coverage described above can be broken down based on different ID types and subdivisions of your traffic, such as coverage on mobile vs. desktop, cookies vs. mobile device IDs, or video vs. display.
As marketers become more sophisticated in their identity management practices, measuring the coverage of their device graphs is becoming an increasingly important priority. Currently there are no industry standards around coverage and each platform has a different process for how they calculate coverage.
What is important is to understand the key considerations outlined above and to know what questions to be asking your vendor.

Have you downloaded our latest white paper, covering the fundamentals of cross-device?
Click here to grab your copy!
Interested in learning more about Cross-Device or Screen6’s Solutions?